Research Article |
|
Corresponding author: MYu Prakhova ( prakhovamarina@yandex.ru ) Academic editor: Aleksandr I. Malov
© 2018 SV Emets, VN Kudayarov, MYu Prakhova.
This is an open access article distributed under the terms of the Creative Commons Attribution License (CC BY 4.0), which permits unrestricted use, distribution, and reproduction in any medium, provided the original author and source are credited.
Citation:
Emets SV, Kudayarov VN, Prakhova MYu (2018) Method for the monitoring of hydrate formation process in intrafield flowlines. Arctic Environmental Research 18(3): 106-114. https://doi.org/10.3897/issn2541-8416.2018.18.3.97
|
Abstract
During the production of gas in the Far North and the Arctic, the formation of hydrate and ice plugs in intrafield flowlines is a major concern. The existing methods for determining the onset of hydrate formation are mostly based on the analysis of pressure-and-temperature conditions and therefore they only allow to detect the occurrence of conditions for hydrate formation. They do not allow to localize the specific place where hydrates start to form. The recently developed methods based on echolocation technology have a number of limitations due to the physical nature of the radiation used in them. The proposed method for the monitoring of hydrate formation processes in intrafield flowlines is based on a combination of analysis of pressure-and-temperature conditions in the flowline and the results of flowlines echolocation obtained by means of periodic generation of scanning pressure waves at the end of the flowline (from the side of the switching valve building). The flowlines are divided into characteristic sections bound by characteristic points linked to the structure of the flowline. The propagation speed of the scanning pressure wave is determined in each measuring cycle within the reference section. This can be any section between the characteristic points to which the distance is precisely known and which produce well-defined waveforms and time-stable reflections of scanning pressure waves, for example, the first section located adjacent to the switching valve building. The obtained echograms are compared with the model echogram, which is obtained from a flowline, which is known to be unclogged. Any abnormal change in the signal amplitude is indicative of an onset of the formation of a new local resistance. The proposed recursion formula makes it possible to calculate the temperature in the proximity of this local resistance and, taking into account the pressure value using the diagram of three-phase equilibria for hydrate-forming gases, to diagnose the possibility of existence of crystalline hydrates at a given point. Since pressure-and-temperature conditions for the formation of ice and hydrates are different, the proposed method is selective and enables accurate prediction of the nature of potential buildups.
Keywords
gas flowlines, gas hydrates, hydrate formation conditions, echolocation, localization of local resistance in the flowline
Introduction
Almost all of Russia’s large natural gas deposits are located in its northern territories – in the Arctic and adjacent areas (
In natural gas production, hydrates management costs reach 20 percent or more of the field cost of gas (
Therefore, all research aimed at studying the hydrate formation processes, timely diagnostics of hydrate formation and prevention of the occurrence of hydrate plugs represents a relevant applied research task.
Almost all methods for the diagnostics of hydrate formation process are based on the analysis of pressure-and-temperature conditions and differ from each other in the algorithms for the processing of this information. Thus, for example, in (
Methods for diagnosing hydrate formation based on wave phenomena have been developed recently (
Thus, the existing monitoring methods either indicate the occurrence of conditions favourable for hydrate formation in one of the flowlines, but do not allow determining the location of the failing section, or enabling the detection of hydrate plugs that have already been formed, with varying degrees of reliability. This article proposes a method for the monitoring of hydrate formation processes in intrafield flowlines based on a combination of analysis of pressure-and-temperature conditions in the flowline and the results of flowline echolocation obtained through periodic generation of a scanning pressure wave at the end of the flowline (from the side of the switching valve building).
Materials and methods
The echolocation method is used in order to determine the location of formation of a new deposit: the distance is determined based on the delay of the scanning pressure wave reflected from the obstacle. Before monitoring, the internal surface of the flowline is cleaned of accumulated deposits by means of cold vent stacks or otherwise.
The echogram of an unclogged pipeline, obtained at the first measurement, is taken as a reference. With the help of the pipeline passport, the characteristic points corresponding to the construction elements of the pipeline forming the response signal are determined on this echogram: bends, elbows, etc. Afterwards, the measurements are periodically repeated.
A reference section of the flowline is selected in order to determine wave propagation velocity: this can be any section between the characteristic points to which the distance is precisely known and which produce well-defined waveforms and time-stable reflections of scanning pressure waves. It is more expedient to select the first section located adjacent to the switching valve building. The calculated wave propagation velocity is determined for each scan session based on the time of passage of reflected wave through the reference section.
After that, the absolute gas temperature Tn (Kelvin temperature) is calculated in the proximity of the new local resistance within section n in accordance with the recurrence formula based on the change of the time of passage of scanning pressure waves through the characteristic sections:
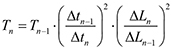 (1)
(1)
where Tn−1 is the absolute temperature within a characteristic section n−1 preceding the characteristic section n; DLn and DLn−1 are the lengths of characteristic sections n and n−1, respectively; Dtn and Dtn−1 are the time of passage of scanning pressure waves through the characteristic sections n and n−1, respectively.
This formula is obtained on the basis of the following considerations.
Fig.

Fragment of the scheme of investigated flowline. KP – construction survey stakes on the flowline; N0…N5 – characteristic points of the pipeline
At the first stage of monitoring, the flowline is broken up into so-called characteristic sections – the sections between characteristic points linked to the structure of the flowline (Fig.

Distribution of temperature Tn within the characteristic sections of the flowline. N0…NM are the characteristic points of the pipeline; L0 …LM is the pipeline length from the installation site of the pressure sensor to the characteristic points N0…NM ; t0…tM is the time of passage of scanning pressure waves through the characteristic points N0…NM ; T1…TM is the temperature in the sections between adjacent characteristic points N0…NM ; M is maximum number of characteristic points of the pipeline
For the general case, the number of sections is assumed to be N. The place of installation of the sensor for the detection of reflected scanning pressure waves is taken as the zero characteristic point. In order to describe the procedure for the determination of temperature within a characteristic section with an arbitrary number n, the first characteristic section – the section between the characteristic point N1 and the sensor for the detection of reflected scanning pressure waves (characteristic point N0) – is taken as the reference section.
Sound propagation velocity in gases (propagation velocity of scanning pressure waves) depends on the temperature through the following ratio:
 (2)
(2)
where ν is the sound propagation velocity in gas; g is the ratio of heat capacity of the gas at constant pressure to heat capacity of the gas at constant volume; R is the universal gas constant; T is the absolute gas temperature in Kelvin; m is the mole mass, which is numerically equal to the molecular weight of the gas.
Therefore:
 (3)
(3)
The sound propagation velocity within the characteristic section No. 1 is calculated by the following formula:
 (4)
(4)
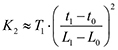
where L1 – L0 is the length of the characteristic section expressed through the difference of distances from the sensor for the detection of reflected waves to the characteristic points N1 and N0; t1 – t0 is the time of passage of scanning pressure waves through the characteristic section expressed through the difference of time intervals from the moment of generation of scanning pressure waves to the detection of reflected signals from the characteristic points N1 and N0. In this particular case L0 = 0 m and t0 = 0 s.
Thus, the temperature in the section between these characteristic points is calculated by the following formula:
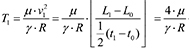 (5)
(5)
This is the gas temperature T1 measured at the end of the flowline.
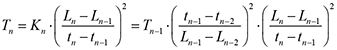
In the general case:
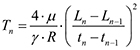 (6)
(6)
Let us introduce the proportionality coefficient K for the convenience of calculations:
 (7)
(7)
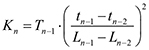
This coefficient is calculated for the reference section based on empirical data:
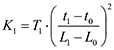 (8)
(8)
Let us assume that the coefficient K within the adjacent characteristic sections does not change or changes insignificantly, i.e.:
 (9)
(9)
or:
 (10)
(10)
 (11)
(11)
Let us introduce the following notation:
∆Ln = Ln– Ln–1 is the length of the nth characteristic section,
∆Ln–2 = Ln–1– Ln–2 is the length of the (n-1)th characteristic section,
∆tn = tn– tn–1 is the time of passage of scanning pressure waves through the nth characteristic section,
∆tn–2 = tn–1– tn–2– is the time of passage of scanning pressure waves through the (n−1)th characteristic section.
Then:
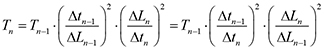 (12)
(12)
This recurrence formula is used to calculate the temperature at any arbitrary nth characteristic section, for which n ≥ 2.
In addition, gas pressure is constantly measured at the switching valve building and the wellhead. The pressure in the proximity of the new local resistance is calculated based on the ratio of obtained values. For this, one of the known models of pressure distribution along the pipeline is used, for example, the one described in the works (
The possibility of existence of crystalline hydrates under the current pressure-and-temperature conditions in the proximity of the new local resistance is determined based on the diagram of three-phase equilibria for hydrating agents contained in produced gas (
All recorded echograms are stored in a database and are used as the basis for analysing and interpreting the technological conditions in the pipeline. The echogram obtained during the current scan session is compared with the reference echogram. As part of the process, any anomalous changes in the signal amplitude resulting from already identified characteristic points (design features of the flowline) and from new buildups are detected. New buildups are localized by location between the characteristic points. After that, a trend analysis of the elements of echograms of scanning pressure waves reflected from the characteristic points is performed with the use of the echogram database, and the result of the analysis allows making a conclusion about the buildup growth process.
In the event that the current pressure-and-temperature regime meets the conditions for the existence of hydrates, it is concluded that there is a potential existence of hydrates within the flowline at the site of the new local resistance.
Results
Fig.
A 24-metre-long section between the valve and the first flowline turn after the switching valve building was taken as a reference section (see Fig.

Reference echograms in time and distance coordinates. Pmax is the amplitude of the scanning pressure wave reflected from the first characteristic point; Р is the current pressure in the flowline; t is the time interval; L is the flowline length; N0… N5 are the characteristic points of the pipeline
The sound propagation velocity in gas under specific pressure-and-temperature conditions is determined based on the length of the reference section and the time interval on the echogram. The temperature within characteristic sections is calculated according to the formula (3).
Fig.
Fig.
Fig.

Discussion
It is expedient to utilize the proposed method primarily in gas fields with a collector-and-multibore gas-collecting scheme. With this method of production, gas from the wells of one well cluster is transported to the switching valve building through a flowline, and various technological complications can occur during the transportation, including the formation of hydrate and ice plugs.
There are several methods for generating scanning pressure waves; for example, closing the flowline valve inside the switching valve building, stoppage of the gas flow until the pressure in front of the valve in the switching valve building is equalized with the wellhead pressure, followed by opening the valve, using low or high pressure receivers, etc. A particular method is selected depending on the energy of the gas flow, which is characterized by its velocity and pressure within the flowline.
The frequency of measurements can vary depending on several factors:
– the pressure-and-temperature conditions within the flowline, depending on the degree of their closeness to hydrate formation conditions;
– dynamics of the amplitude growth of reflected signal at characteristic points;
– flow velocity.
Typically, scan frequency amounts to 0.5...1.5 hours, depending on the temperature of the gas within the flowline and the dynamics of the amplitude of reflected signal at characteristic points of the echogram.
The measurements can be performed with the use of any pressure sensor with a high polling frequency, for example, the PX409 family (
Conclusions
The main advantage of proposed method for the monitoring of condition of gas flowlines is the ability to predict the formation of ice and hydrates based on current pressure-and-temperature conditions, and the refinement of these conditions is performed during each scanning session. Since the pressure-and-temperature conditions for the formation of ice and hydrates are different, the proposed method is selective and enables accurate prediction of the nature of potential buildups, i.e. it enables the diagnostics of the nature of newly formed local resistance based on direct (pressure-and-temperature conditions), rather than indirect (e.g. dielectric permittivity factor) indicators.
Alongside with that, this method, simultaneously with the diagnostics of the very fact of the emergence of a new local resistance, enables the determination of its location with an accuracy sufficient for technological purposes (maximum error ± 10 m).
Since the place of formation of the plug is determined with the use of scanning pressure waves, monitoring can be performed on long flowlines regardless of the presence of bends, since pressure waves attenuate less than, for example, electromagnetic waves, as they pass through the sections of pipelines with right angle bends. Thus, this method can be used on the flowlines with any type of profile and length, including in the conditions of the Far North and the Arctic.
From the economic point of view, the use of this method is also justified, since its implementation does not require such costly operations as the delivery of special tools to the installation site, capital works related to the installation of equipment on the flowline, etc. The pressure and temperature sensors required for the operation of the system are either already available on the flowline or installed in regular places for the installation of process control instruments.
References
- AndreyevOP, SalikhovZS, AkhmetshinBS et al. (2008) Method of hydration control in intrafield flowlines of gas and gas-condensate pools in Far North. Patent RU 2 329 371 [published on 20 July 2008]
- Anonymous (2018) High accuracy pressure transducers. https://www.omega.com/pressure/pdf/PX409_SERIES.pdf [access date 18 April 2018]
- ArnoOB, ArabskyAL, AkhmetshinBS et al. (2016) Method to control hydrate formation process in gas-gathering flow lines connected to common manifold at Far North gas and gas condensate deposits. Patent RU 2 573 654 [published on 27 January 2016]
- BaillieC, WichertB (1987) Chart gives hydrate formation temperature for natural gas.Oil & Gas Journal4: 37–39.
- BakkeKI (2000) Method and device for monitoring flow parameters in a pipeline in order to register hydrate formation. Patent WO 00/46545 [published on 10 August 2000]
- BukhgalterEB (1986) Methanol and its use in the gas industry.Nedra Publishing House, Moscow, 238 pp.
- ButsVV (2010) Mathematical model of hydrate formation during the movement of natural gas in pipelines in the presence of an inhibitor.Neftegaz Territory Magazine6: 20–24.
- BykSSh, MakagonYuF, FominaVI (1980) Gas hydrates.Khimiya Publishing House, Moscow, 296 pp.
- GrigoryevM (2018) Development forecast of mineral resource centers of crude oil and gas in the Arctic zone with a marine transportation scheme. Neftegaz.ru5: 50–57.
- GroysmanAG (1985) Thermophysical properties of gas hydrates.Nauka Publishing House, Novosibirsk, 94 pp.
- GrunwaldAV (2007) Growth of methanol consumption in the gas industry of Russia and geoecological risks arising from its use as an inhibitor of hydrate formation. Oil and Gas Business Electronic Scientific Journal 2: 3. http://ogbus.ru/authors/ Grunvald/Grunvald_2.pdf
- HammerschmidtEG (1934) Formation of gas hydrates in natural gas transmission lines.Industrial and Engineering Chemistry26(8): 851–855.
- IstominVA, KvonVG (2004) Prevention and elimination of gas hydrates in gas production systems. OOO IRC Gazprom, Moscow.
- JacobsenJ, BergA, VilmingS (2011) Acoustic method and device for the detection of medium and determining its characteristics. Patent RU 2 431 828 [published on 20 October 2011]
- McLeodHO, CampbellJM (1961) Natural gas hydrates at pressures to 10,000 psia.Journal of Petroleum Technology13(6): 590–594.
- PrakhovaMYu, KrasnovAN, KhoroshavinaEA (2017) Automatic system for early detection of hydrate formation in gas flowlines based on cognitive models. Arctic Environmental Research 3. https://cyberleninka.ru/article/n/avtomaticheskaya-sistema-rannego-obnaruzheniya-gidratoobrazovaniya-v-gazovyh-shleyfah-na-osnove-kognitivnyh-modeley
- PrakhovaMYu, KrasnovAN, KhoroshavinaEA, ShalovnikovEA (2016) Methods and means of preventing hydrate formation at gas production sites.Oil and Gas Business Electronic Scientific Journal1: 101–118.
- PrakhovaMYu, KhoroshavinaEA, KrasnovAN, ZakirnichnayaMM (2017) Сognitive model application for automatic system of methanol supply to flowlines. IOP Conference Series: Earth and Environmental Science; Ser. “Innovations and Prospects of Development of Mining Machinery and Electrical Engineering – Mining and Exploration of Mineral Resources” 2017. С. 052023. https://elibrary.ru/item.asp?id=31067515
- SloanED (1998) Natural Gas Clathrate Hydrates.Marcel Dekker, New York, 754 pp.
- StepanovaGS, BurmistrovAG (1986) A refined method for the calculation of conditions for hydrate formation. Gas Industry Magazine 10: 47.