|
||
|
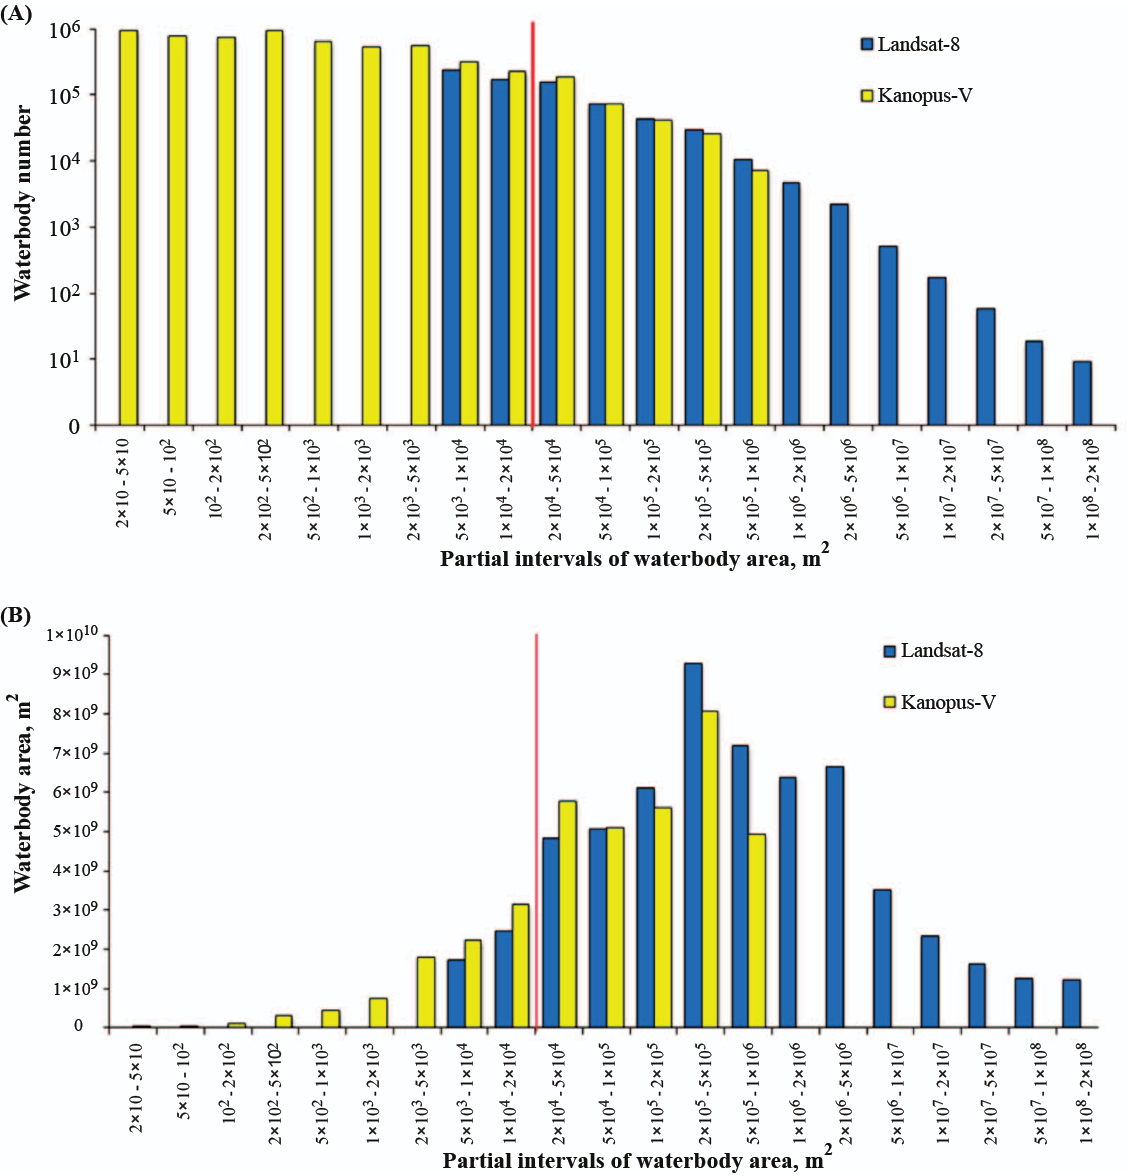
The illustration of MR (Landsat-8, black columns) – HR (Kanopus-V, white columns) lake number (A) and area (B) histogram coupling within the total range of 20 to 2×10⁸ m² with and overlap in the range of 5×10³ to 106 m². Vertical line marks the point of integration (stitching) of high and medium-resolution-based lake diagrams |